Showing posts with label BTC. Show all posts

Tezos (XTZ) Bakes The Crypto Competition With 27% Weekend Surge

December 08, 2019 0

The weekend has seen marginal gains for most crypto assets as total market capitalization claws back above $200 billion. Tezos has been the clear leader in terms of performance though as it tops $1 billion market cap and closes in on a top ten position.

Tezos Outperforming Crypto Markets

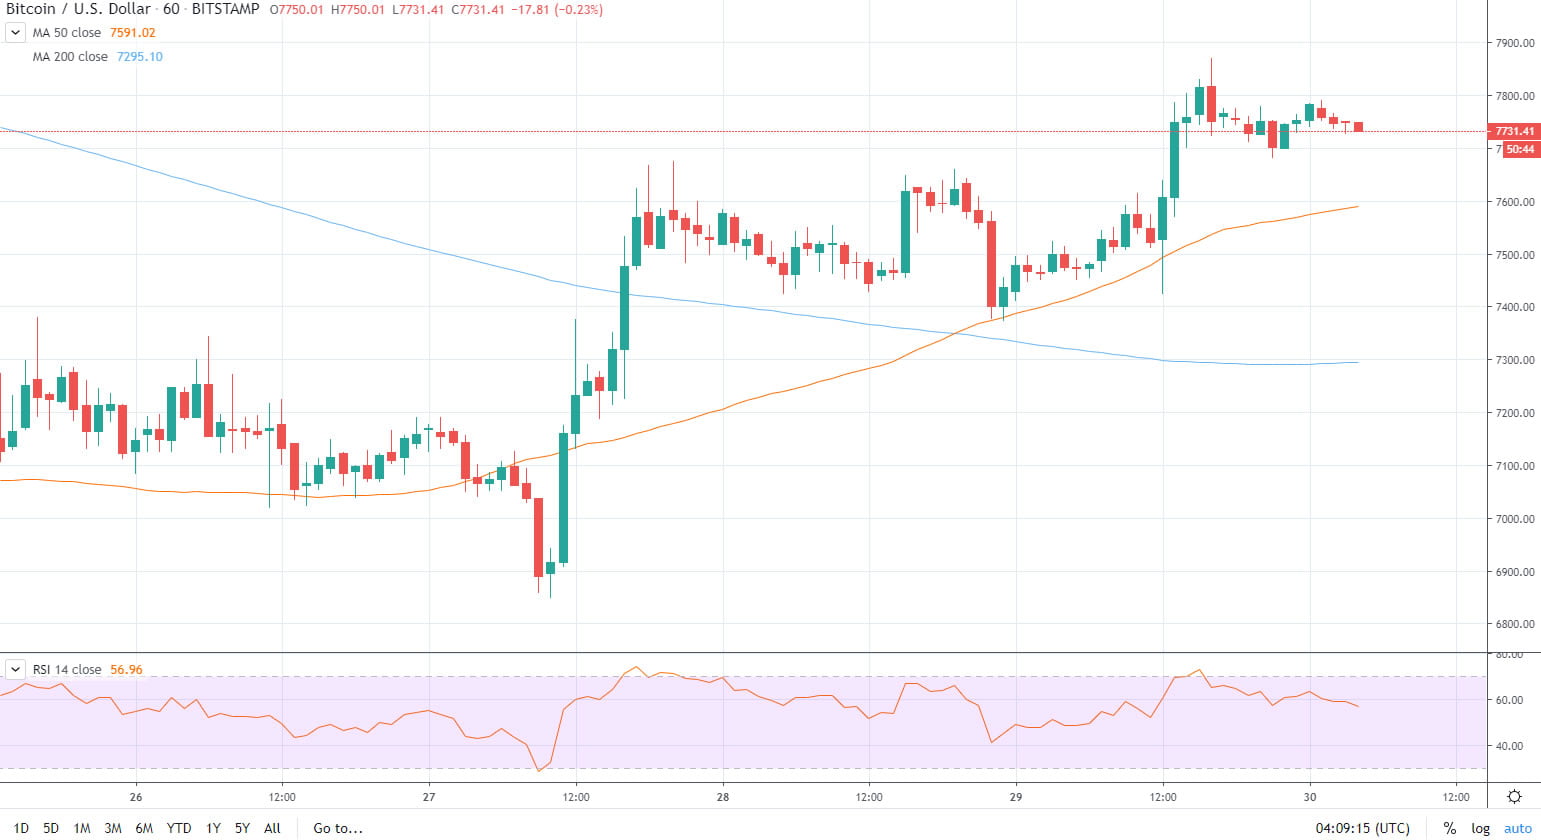
The good news is that there has been no big crypto dump over the weekend and most digital currencies have ground slightly higher. Bitcoin has continued consolidating as it pushes above $7,500 while the altcoins get dragged along with it. Only one has made any real progress over the past couple of days.

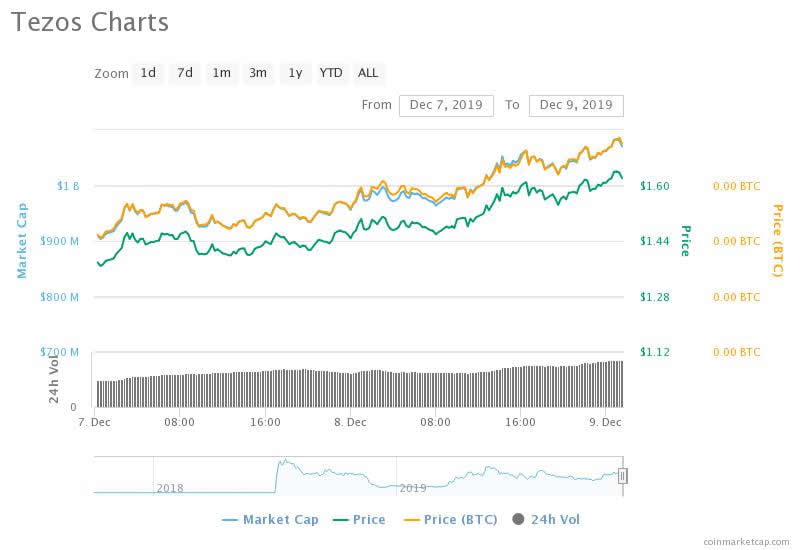
Tezos has just flipped Cardano as its market capitalization topped a billion dollars for the third time this year. Starting the weekend priced around $1.30 XTZ surged to hit an intraday high of $1.65 a couple of hours ago. The move equates to 27% over just two days making this altcoin the top performer by a large margin.

crypto Tezos

Daily volume for XTZ cranked from under $40 million to almost $70 million with Binance and OKEx taking the majority of the trade, followed by Coinbase Pro. Since the beginning of the year Tezos has made a whopping 250%, outperforming Bitcoin itself and most of the other altcoins which have dumped all of their 2019 gains.

The move was not lost on project supporters such as Kevin Mehrabi.

Naturally there is still a lot of crypto tribalism with many seeing this as an opportunity to bash rival blockchain platforms EOS and Ethereum.

Tezos Fundamentals

There could be a number of reasons for the bullish momentum for this crypto asset. Staking opportunities are now available on the world’s two leading crypto exchanges, Coinbase and Binance. Last week Binance announced that it would support zero fee Tezos staking and Coinbase is pushing education on XTZ by giving a little away to those that watch videos on it.

Just like rival platforms, development is still continuing with Tezos and there was a hint from Foundation CSO and council member Ryan Lackey that there may be joint funding for Ethereum Foundation teams.

“If any EF funded teams are looking to continue working on similar things in a cross-blockchain way, Tezos Foundation would potentially be interested in providing funding.”

A recent announcement also added that there were several layer 2 projects waiting to go live on mainnet soon. The TzStats Smart Contract API for Tezos is scheduled to go live on December 12. It will allow developers to write applications without getting buried in complex code.

At the moment Tezos is clearly leading things on crypto markets in terms of performance. Even Ethereum, which has just successfully undergone the Istanbul network upgrade, has not seen much movement today in terms of price. XTZ appears to be the crypto darling of the moment, but how long will the FOMO last?

Image from Shutterstock

The post Tezos (XTZ) Bakes The Crypto Competition With 27% Weekend Surge appeared first on NewsBTC.


from NewsBTC https://ift.tt/2E181z3
Ethereum (ETH) Bulls Eye Crucial Bullish Break

December 08, 2019 0
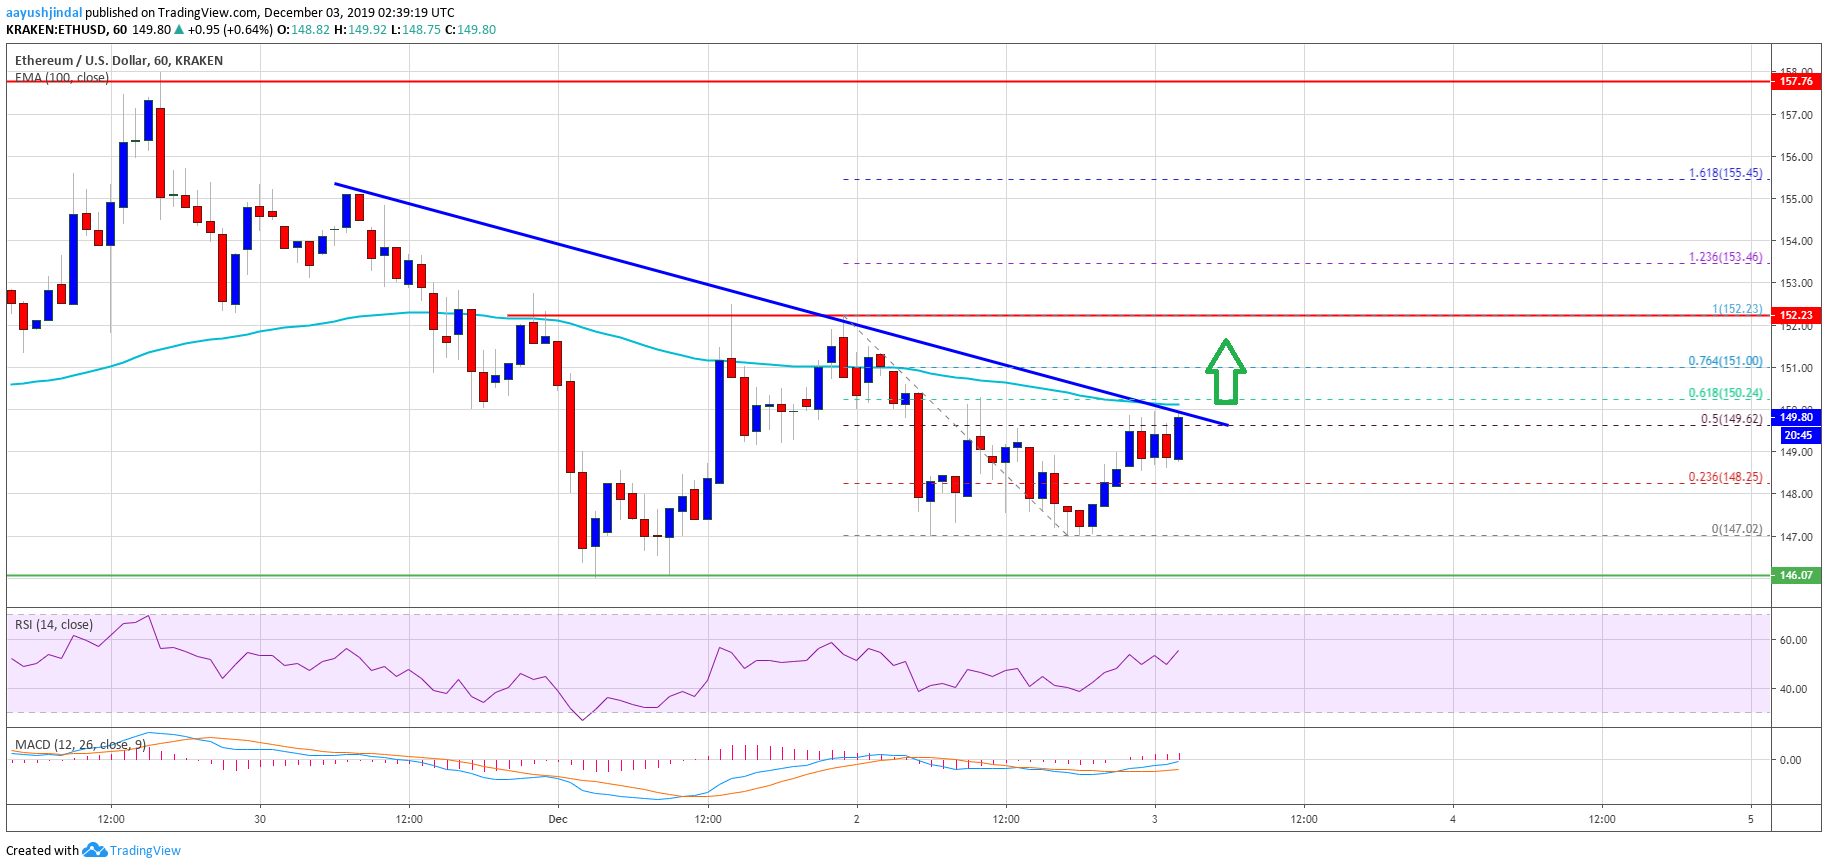
  • Ethereum is approaching the main $152 and $155 resistance levels against the US Dollar.
  • The price is likely to rally significantly once there is a clear break above $152.
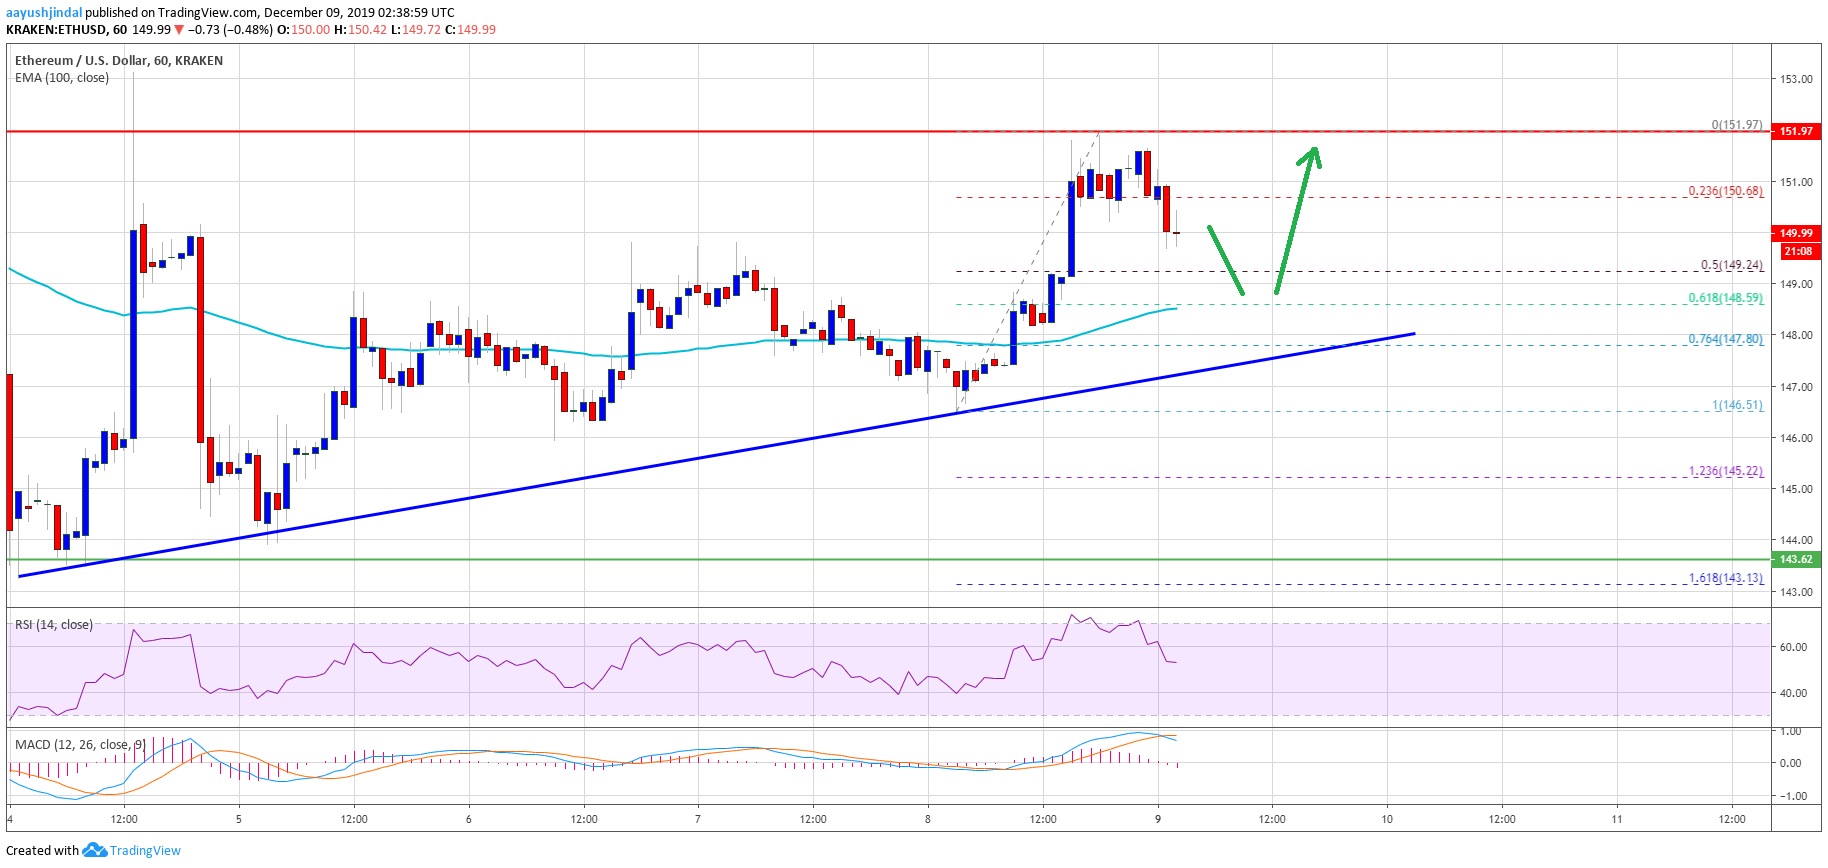
  • There is a key bullish trend line forming with support near $148 on the hourly chart of ETH/USD (data feed via Kraken).
  • The price could dip a few points, but it remains supported near $148 and $145.

Ethereum price is trading with a positive bias versus the US Dollar, similar to bitcoin. ETH price needs to rally above $152 to continue higher in the coming sessions.

Ethereum Price Analysis

After forming a support base above $144, Ethereum started a decent upward move against the US Dollar. ETH price is rising steadily and it recently climbed above the $148 resistance area.

Moreover, there was a break above the $150 resistance and the 100 hourly simple moving average. However, the price ran into a crucial resistance area near $152, where the bears protected further upsides.

A high is forming near $152 and the price is currently correcting lower. An immediate support is near the $149.50 area. Besides, the 50% Fib retracement level of the upward move from the $146 swing low to $152 high is also near $149.

More importantly, there is a key bullish trend line forming with support near $148 on the hourly chart of ETH/USD. Therefore, Ethereum is likely to find a strong buying interest near the $149 and $148 levels.

Additionally, the 61.8% Fib retracement level of the upward move from the $146 swing low to $152 high is near the $148 level and the 100 hourly simple moving average.

If there is a downside break below the $148 support, the price could continue to move down towards the main $144 support area in the near term.

Conversely, the bulls are likely to make another attempt to surpass the $152 resistance area. In the mentioned case, there are high chances of a sharp rally above the $152 and $155 resistance levels.

The next major resistance is near the $158 level. Thus, a successful close above $158 could signal a trend change in the medium term and the price could climb towards $172.

Ethereum Price ETH Chart

Ethereum Price

Looking at the chart, Ethereum price is trading in a positive zone above the $148 and $144 support levels. In the short term, there could be a downside correction, but the price is likely to bounce back.

ETH Technical Indicators

Hourly MACD The MACD for ETH/USD is slowly moving back into the bearish zone.

Hourly RSI The RSI for ETH/USD is currently just above the 50 level, with a few positive signs.

Major Support Level – $144

Major Resistance Level – $152

The post Ethereum (ETH) Bulls Eye Crucial Bullish Break appeared first on NewsBTC.


from NewsBTC https://ift.tt/2Ppc6m5

Last Weekly Golden Cross Led Bitcoin to Rally 75% Rapidly; Will the Same Happen Now?

December 08, 2019 0

If you’ve been on Crypto Twitter at all over the past few months, you’ve likely noticed the phrase “Bitcoin golden cross” tossed around incessantly. The reason, the leading cryptocurrency’s weekly chart is on the verge of printing what is known as a “golden cross,” when a short-term moving average crosses over a long-term one to imply bulls have control.

Some analysts have suggested that this chart formation could lead to immediate gains for the Bitcoin market, though this may not be a certainty.

Related Reading: Wyckoff Schematic Suggests Bitcoin Bottom Not In at $6,600: Analyst

Last Bitcoin Weekly Golden Cross Led to 75% Gains

In a few hours’ time, Bitcoin’s weekly chart is expected to print a golden cross of the 50-week and 100-week simple moving averages, with the former crossing above the latter. As an analyst recently pointed out, the last time this was seen, BTC surged by 75% in the four to five weeks that followed the cross.

But will this happen again?

Related Reading: 15% Jump to $8,500 on the Table for Bitcoin Price; Analyst Explains Why

While there will be a golden cross that is reminiscent of the one seen in 2015, there is a key difference in the backdrop now compared to back then: long-time cryptocurrency trader Sakura noted that in 2015, the market structure was decisively bullish and upward-trending in the months leading up to the 50-100 golden cross; now, Bitcoin’s chart structure is largely negative, with the cryptocurrency remaining in a downtrend that began in June, marked by lower highs and lower lows.

This difference seems to imply that Bitcoin is unlikely to see a 75% gain, which would bring the cryptocurrency to $13,000 from current prices, in the coming weeks.

But make no mistake, the cryptocurrency ball is starting to enter into the court of bulls once again, according to a number of top analysts.

Ball In the Court of Bulls

Earlier this week, Mike McGlone, a Bloomberg Intelligence analyst, released his latest cryptocurrency market outlook. In the report, McGlone revealed that he’s starting to flip bullish on Bitcoin, going as far as to say that it is only a matter of time before the asset breaches resistance at $10,000.

Per previous reports from this outlet, the analyst noted that he thinks gold will rally, and thus so will Bitcoin. Indeed, the macro picture is starting to favor alternative assets: a potential recession, restart of the trade war due to Hong Kong and Xinjiang regulations, and other underlying issues in the traditional system.

McGlone added that with the impending block reward reduction and developments in the adoption of cryptocurrencies, he would expect the asset to soon surmount $10,000.

There’s also sentiment from Adaptive Capital partner Willy Woo, a prominent analyst who recently wrote that on-chain metrics are implying that investors are bullish once again. With this in mind, he asserted that the “bottom is most likely in,” meaning that any move lower than the $6,500 plunge “will be just a wick in the macro view.” He added that the unnamed indicator also implies that cryptocurrency investors will start to front-run the impending “halving,” the block reward reduction that will be taking place in May 2020.

Related Reading: Crypto Tidbits: Deutsche Bank Gives Nod to Bitcoin, EOS to Host Social Media, France Digital Currency
Featured Image from Shutterstock

The post Last Weekly Golden Cross Led Bitcoin to Rally 75% Rapidly; Will the Same Happen Now? appeared first on NewsBTC.


from NewsBTC https://ift.tt/2RxDIrW

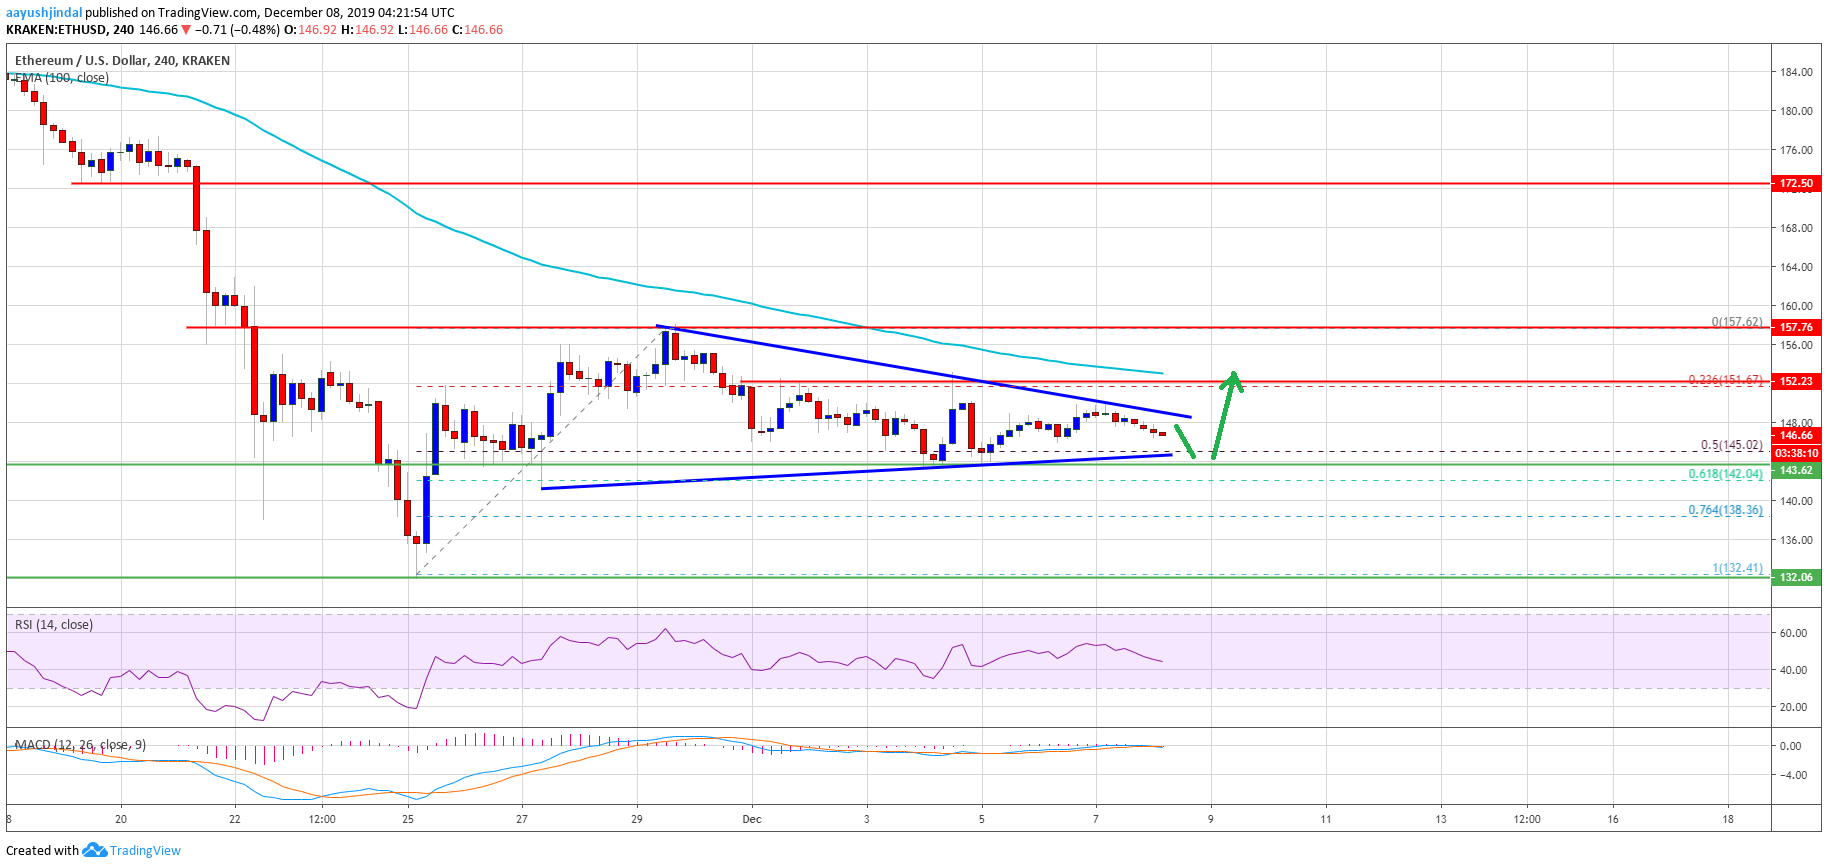
Ethereum Price Weekly Forecast: ETH Reversal Could Unfold Above $158

December 07, 2019 0
  • ETH price is struggling to gain pace above the $152 and $158 resistance levels against the US Dollar.
  • The price is currently holding the main $144 support area and breakdown zone.
  • There is a key contracting triangle forming with resistance near $150 on the 4-hours chart of ETH/USD (data feed via Kraken).
  • The pair could start a strong upward move once it surpasses $152 and $158.

Ethereum price is trading above a few important supports against the US Dollar, similar to bitcoin. ETH price needs to settle above $158 for an uptrend reversal.

Ethereum Price Weekly Analysis

At the end of the last month, Ethereum tested the $158 resistance area against the US Dollar, where it faced a lot of hurdles. A high was formed near $158 and the price started a downside correction.

It broke the $152 support and remained well below the 100 simple moving average (4-hours). Moreover, there was a break below the 23.6% Fib retracement level of the upward move from the $132 swing low to $158 high.

However, the $144 and $145 levels are acting as strong buy zones. Besides, the 50% Fib retracement level of the upward move from the $132 swing low to $158 high is acting as a support.

At the outset, there is a key contracting triangle forming with resistance near $150 on the 4-hours chart of ETH/USD. The triangle support is near the $144 area.

Therefore, a successful break below the $144 support might start another bearish wave below the $140 level. The next major support is near the $132 swing low. Any further losses could lead Ethereum price towards the $125 zone.

On the upside, there are many resistances, starting with the triangle resistance near $150. If there is an upside break above $150 and $152, the price could revisit the $158 resistance area.

To start a fresh increase and uptrend, the price must settle above the $158 resistance and the 100 simple moving average (4-hours). In the mentioned bullish case, the price is likely to rally above the $160 and $165 levels. The next major resistance is near the $172 level.

Ethereum Price

Ethereum Price

The above chart indicates that Ethereum price is trading above an important support near $144. As long as there is no bearish break below the $144 support, there are high chances of a strong rally above the $152 and $158 resistance levels.

Technical Indicators

4 hours MACD – The MACD for ETH/USD is currently losing strength in the bullish zone.

4 hours RSI – The RSI for ETH/USD is currently declining and it is below the 50 level.

Major Support Level – $144

Major Resistance Level – $158

The post Ethereum Price Weekly Forecast: ETH Reversal Could Unfold Above $158 appeared first on NewsBTC.


from NewsBTC https://ift.tt/2YzPPWY

Bitcoin Weekly Forecast: BTC Won’t Go Quietly, Risk of Bounce Grows

December 07, 2019 0
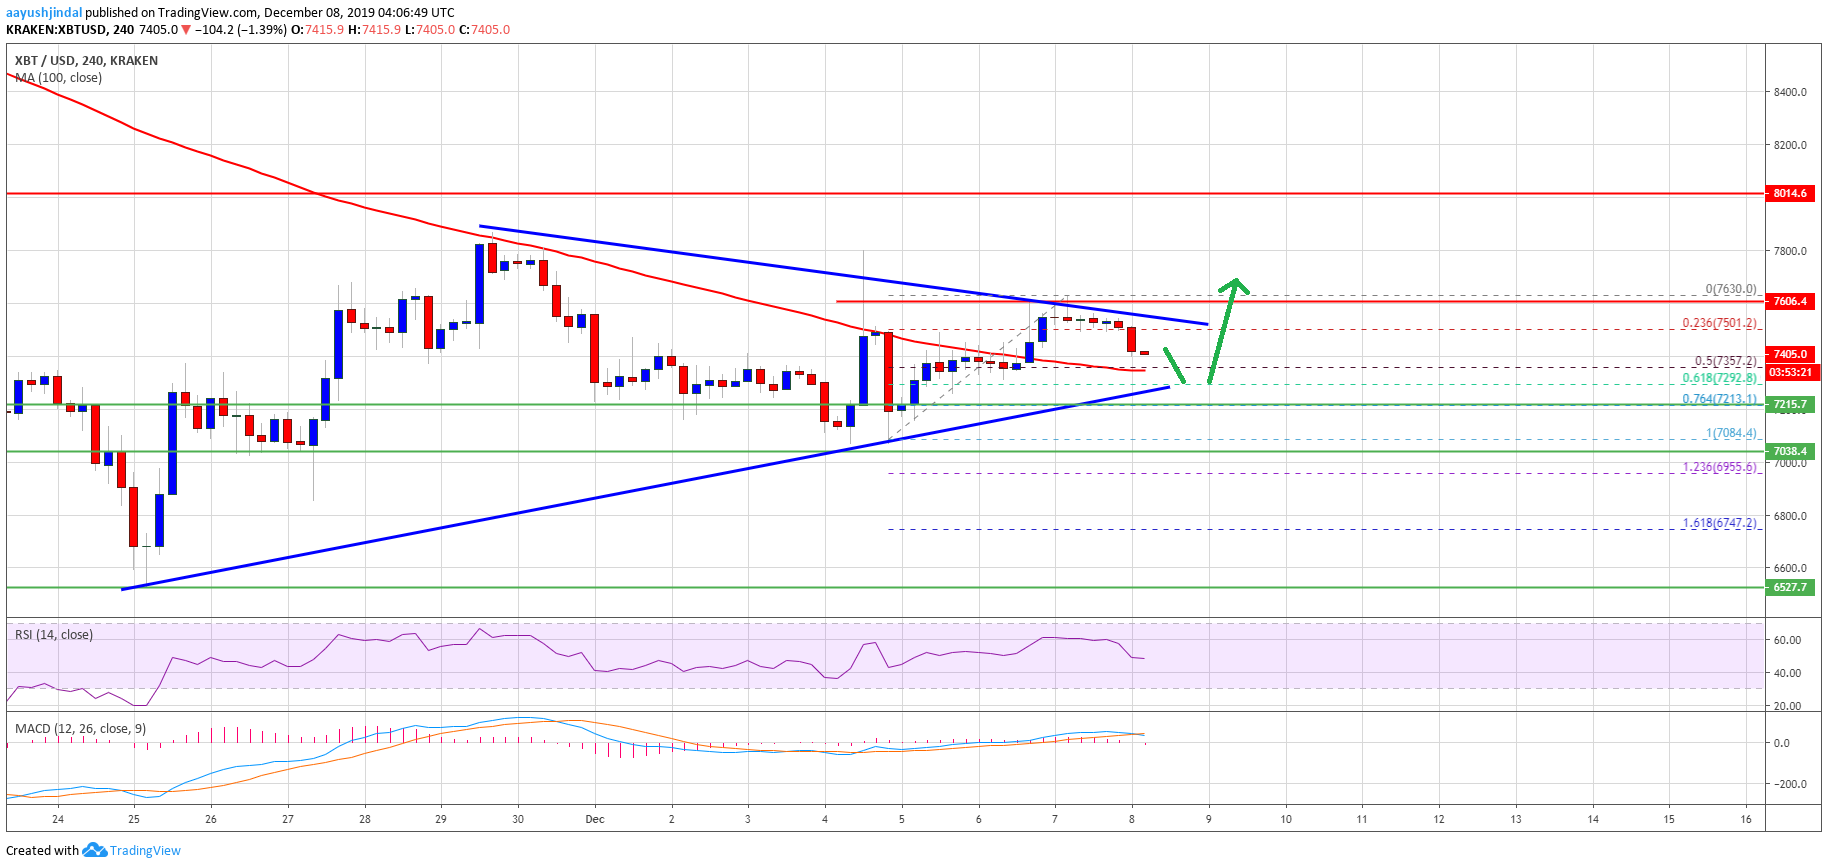
  • After forming a base above $7,000, bitcoin price climbed above the $7,500 resistance against the US Dollar.
  • The price is currently correcting gains and it is trading below the $7,440 level.
  • There is a major contracting triangle forming with resistance near $7,520 on the 4-hours chart of the BTC/USD pair (data feed from Kraken).
  • The price is likely to stay above the $7,220 support and it could rally above the $7,500 resistance.

Bitcoin price is trading above a couple of important supports against the US Dollar. BTC is likely to rally and it could surge above the $7,500 resistance as long as above $7,000.

Bitcoin Price Weekly Analysis (BTC)

This past week, bitcoin remained well bid above the $7,000 and $7,080 support levels against the US Dollar. BTC price formed a support base above $7,220 and started a decent recovery wave.

The price climbed above the $7,400 resistance and the 100 simple moving average (4-hours). Moreover, the price surpassed the $7,500 and $7,550 resistance levels. A high was formed near the $7,630 and the price is currently correcting lower.

There was a break below the $7,500 pivot level. Besides, the price traded below the 23.6% Fib retracement level of the upward wave from the $7,084 low to $7,630 high.

On the downside, an immediate support is near the $7,360 level. Additionally, the 50% Fib retracement level of the upward wave from the $7,084 low to $7,630 high is also near the $7,360 level.

The first important support is near the $7,300 level (the previous breakout resistance zone) and the 100 simple moving average (4-hours). Therefore, a downside break below the $7,320 support could increase selling pressure on bitcoin.

The next major support is near the $7,220 level. Any further losses may perhaps lead the price towards the $7,080 support area, below which there is a risk a drop below $7,000.

On the upside, the price is facing a lot of hurdles near the $7,500 level. More importantly, there is a major contracting triangle forming with resistance near $7,520 on the 4-hours chart of the BTC/USD pair. If there is an upside break above the $7,520 resistance, the price could even rally above the $7,630 high.

Bitcoin Price

Bitcoin Price

Looking at the chart, bitcoin price is clearly trading above a couple of key supports near $7,220 and $7,080. Thus, there are high chances of an upside break above $7,530 unless the bulls fail to keep the price above $7,220 and $7,080.

Technical indicators

4 hours MACD – The MACD for BTC/USD is currently losing bullish momentum.

4 hours RSI (Relative Strength Index) – The RSI for BTC/USD is now declining and it is just below the 50 level.

Major Support Level – $7,220

Major Resistance Level – $7,530

The post Bitcoin Weekly Forecast: BTC Won’t Go Quietly, Risk of Bounce Grows appeared first on NewsBTC.


from NewsBTC https://ift.tt/2DYOIGS

Bitcoin Price Still on Track to Hit $6,200, Eerily Accurate Fractal Predicts

December 06, 2019 0

Bitcoin’s precipitous drop to $6,600 seen earlier this month caught many traders aback; nearly no one, not even the top traders and analysts, expected for that price action to play out as it did in real life. Few predicted the subsequent bounce to $7,800, where BTC sits as of the time of writing this, too.

Though, one trader has been calling the moves all along, using a lesser-known and slightly unorthodox method of analysis to predict the directionality of the Bitcoin and cryptocurrency market.

Related Reading: Eat My Shorts: Everything You Need To Know About The Bitcoin Bart Pattern

Bitcoin Fractal Implies 18% Drop

Over the past few months, a popular trader on Twitter, NebraskanGooner, has been touting what is known as a “fractal” via his social media pages.

A quick aside for those unaware of what a fractal is: a fractal, in financial markets, is when the historical price pattern or direction of an asset is reflected/seen again on a different time frame and/or for a different asset. While some analysts see them as pure coincidences, analyses have found that fractals can work well for Bitcoin and other cryptocurrencies, potentially due to the inherent cyclicity of this market.

Related Reading: Bitcoin CME Futures Gaps Are Filled With 95% Certainty, But Trading Them Is Risky

The fractal predicted the cryptocurrency’s dramatic price drop to $6,600 weeks before it took place, and the subsequent recovery to nearly $8,000 seen a week or two back. Now, as Nebraskan recently pointed out, it shows that Bitcoin is about to fall off a precipitous cliff in the coming week or two, in a move that may bring the price of BTC to $6,200, maybe even lower. That would represent an 18% drop from current levels.

That’s not all. The analyst pointed out in a separate post that Bitcoin’s weekly chart looks bearish again in spite of the fact that a recovery was seen after the strong move lower. The analyst specifically remarked that BTC failed to break the key 99-week simple moving average and a horizontal zone of resistance, before adding that the “increased buyer volume” narrative is a clear misnomer and that the on-balance volume indicator saw a bearish retest.

With that in mind, the cryptocurrency trader remarked that he expects for Bitcoin to see a “slow bleed” lower, which will be marked by investors trying to buy the dip and then being stopped out, then a “fast dip with rapid absorption” in the $6,000s.

Related Reading: Over $5 Billion Worth of Bitcoin Moved in Minutes; What Happened?
Featured Image from Shutterstock

The post Bitcoin Price Still on Track to Hit $6,200, Eerily Accurate Fractal Predicts appeared first on NewsBTC.


from NewsBTC https://ift.tt/2DRYZnV

Central Banks Issuing Digital Currency Could Be a Bluff; Here’s How

December 06, 2019 0

Going by recent headlines, it appears as though central banks around the world are planning to or in the process of creating their own digital currencies.

The coins, by their disruptive nature, are bound to attract attention from these banks. And with Facebook’s plans to launch the Libra, there are ever-growing challenges to their monetary authority and uncertainty about how money will be used in the coming years.

Central Bank Digital Currency, a Bluff?

Despite all this talk about central banks launching their own digital currencies, it’s an “elaborate bluff,” according to Financial Times

Christine Lagarde at the European Central bank (ECB) gave a contradictory position this week when she told the European Parliament that central bank-issued digital currencies (CBDCs) were “an area where we have to rush slowly.”

“There is clearly a demand and there is clearly a technology that would support it, but clearly there are also risks for the international monetary system and financial stability at large,” she added.

It is clear that the idea of the Libra a digital currency that promises to make payments quicker, cheaper, and easier for Facebook’s almost 2.5 billion users — has been a serious wake-up call for central bankers. They worry about all kinds of risks, including its operational robustness, customer protection, money laundering, terrorism finance, and data privacy.

But the biggest concern is that Libra, and other digital currencies like Bitcoin, have the potential to dilute the main power of central banks: their ability to control the supply of money.

Benoît Cœuré, the ECB director who led the G7 working group on the Libra, has likened Facebook’s digital currency to an “elephant in the sandbox;” French finance minister Bruno Le Maire warned the country could ban the Libra.

Faced with such concerns, central banks are moving cautiously.

Contradictions Apparent

Of note is that ECB insiders say it has no laboratory working on a digital euro and little intention to create one any time soon.

It seems most of these recent comments seem designed push private sector banks into improving inefficient, costly, and time-consuming cross-border payments.

Cœuré recently praised an initiative by about 20 large European banks including BNP Paribas and Deutsche Bank to create a new digital payments system: the Pan European Payment System Initiative (Pepsi). The idea is to enable instant cashless payments through a European rival to ApplePay in the US and Alipay in China.

In the same speech, Cœuré again touched on the possibility of the ECB issuing its own digital currency, saying: “Potential central bank initiatives should not discourage or crowd out private market-led solutions for fast and efficient retail payments in the euro area.”

With the contradictions apparent, this talk of central banks issuing digital currencies could just be a distraction as they are secretly hoping the private sector will come up with solutions that make issuing a CBDC unnecessary altogether. 

What is for certain is that central banks are worried about what the future holds for them.

Featured Image from Shutterstock

The post Central Banks Issuing Digital Currency Could Be a Bluff; Here’s How appeared first on NewsBTC.


from NewsBTC https://ift.tt/2sVTpyZ

Bitcoin & Litecoin Improve Sports Fan Experience and Expose New Audiences to Crypto

December 05, 2019 0

The Miami Dolphins are accepting crypto asset payments in partnership with Aliant Payments and the Litecoin Foundation.

An increasing number of professional sports teams are using the coins as well as associated betting platforms to offer fans an enhanced experience. This exposure of crypto asset to a larger audience looks to help spread awareness, increase adoption, and educate fans on the benefits of blockchain-based payments.

Litecoin Foundation Partners with Dolphins

The deal with Litecoin, the fifth-largest crypto asset, makes it the Miami Dolphin’s official coin and provides it with in-game branding and advertising at Hard Rock Stadium and online.

The experience lets fans use Litecoin to purchase 50/50 raffle tickets – of which half of the proceeds go to the Miami Dolphins Foundation – both online and at 14 kiosks and raffle stations.

As of October, Aliant reported 46 Litecoin transactions at the then-most recent home game. When the partnership initiated the 50/50 raffle, the proceeds jumped from an average of $72,000 per game to $86,000.

Aliant CEO Eric Brown hinted at talks with several additional professional sports teams speaking at October’s Litecoin Summit. Brown suggested several baseball, football and basketball teams were potentially in line to start accepting crypto asset, including the heavy-handed hint of “America’s Team,” aka the Dallas Cowboys.

As for others in the US, the NBA’s Sacramento Kings were way ahead of the pack, accepting Bitcoin back in 2014 and MLB’s Los Angeles Dodgers hosted a crypto giveaway last fall. Despite these forays, in general, it appears US sports teams have been slower to adopt than sports organizations overseas. 

Crypto in Sports Across the Pond

Litecoin, cryptocurrency

The Bitcoin logo (₿) appears on the shirt sleeve of Watford FC this season as part of a wider campaign to improve awareness around Bitcoin and educate the public on the benefits of using cryptocurrencies.

As for the English Premier League, global multi-asset investment platform eToro signed an ad partnership with six teams this August for the 2019/2020 season, putting them on-par with Adidas, who are the most used team kit supplier in the league.

In connection, this September it was revealed that he Bitcoin logo () would appear on the sleeve of Watford FC as part of an educational drive led by the innovative sports betting brand Sportsbet.io.

As for the European continent, Ubisoft-backed, fantasy soccer game Sorare has signed several European clubs to create a blockchain trading card game featuring the world’s top footballers. Among the clubs that have signed on to participate include several from major German and Spanish soccer leagues, such as Atletico Madrid, Schalke 04, and Valencia CF.

The large majority of these sponsorships are not inked explicitly to make money, but more for education and brand recognition. Although doing a partnership with a team isn’t driving major revenue for the crypto assets themselves, it has become a crucial pathway to get these payment methods in front of a wider audience that may have never otherwise heard of them.

“This collaboration propels Litecoin in front of an audience of millions of people around the world at a time where adoption of cryptocurrencies continues to gain momentum and the ecosystem is able to support real-world use cases in ways previously not possible,” Charlie Lee, Litecoin creator and managing director of Litecoin Foundation said.

“We see this as a powerful way to raise awareness and educate people about Litecoin and crypto on a tremendous scale,” he added.

Featured Image from Shutterstock

The post Bitcoin & Litecoin Improve Sports Fan Experience and Expose New Audiences to Crypto appeared first on NewsBTC.


from NewsBTC https://ift.tt/2LuYQeC

Ripple (XRP) Price Could Revisit $0.2000, BTC & ETH Under Pressure

December 04, 2019 0
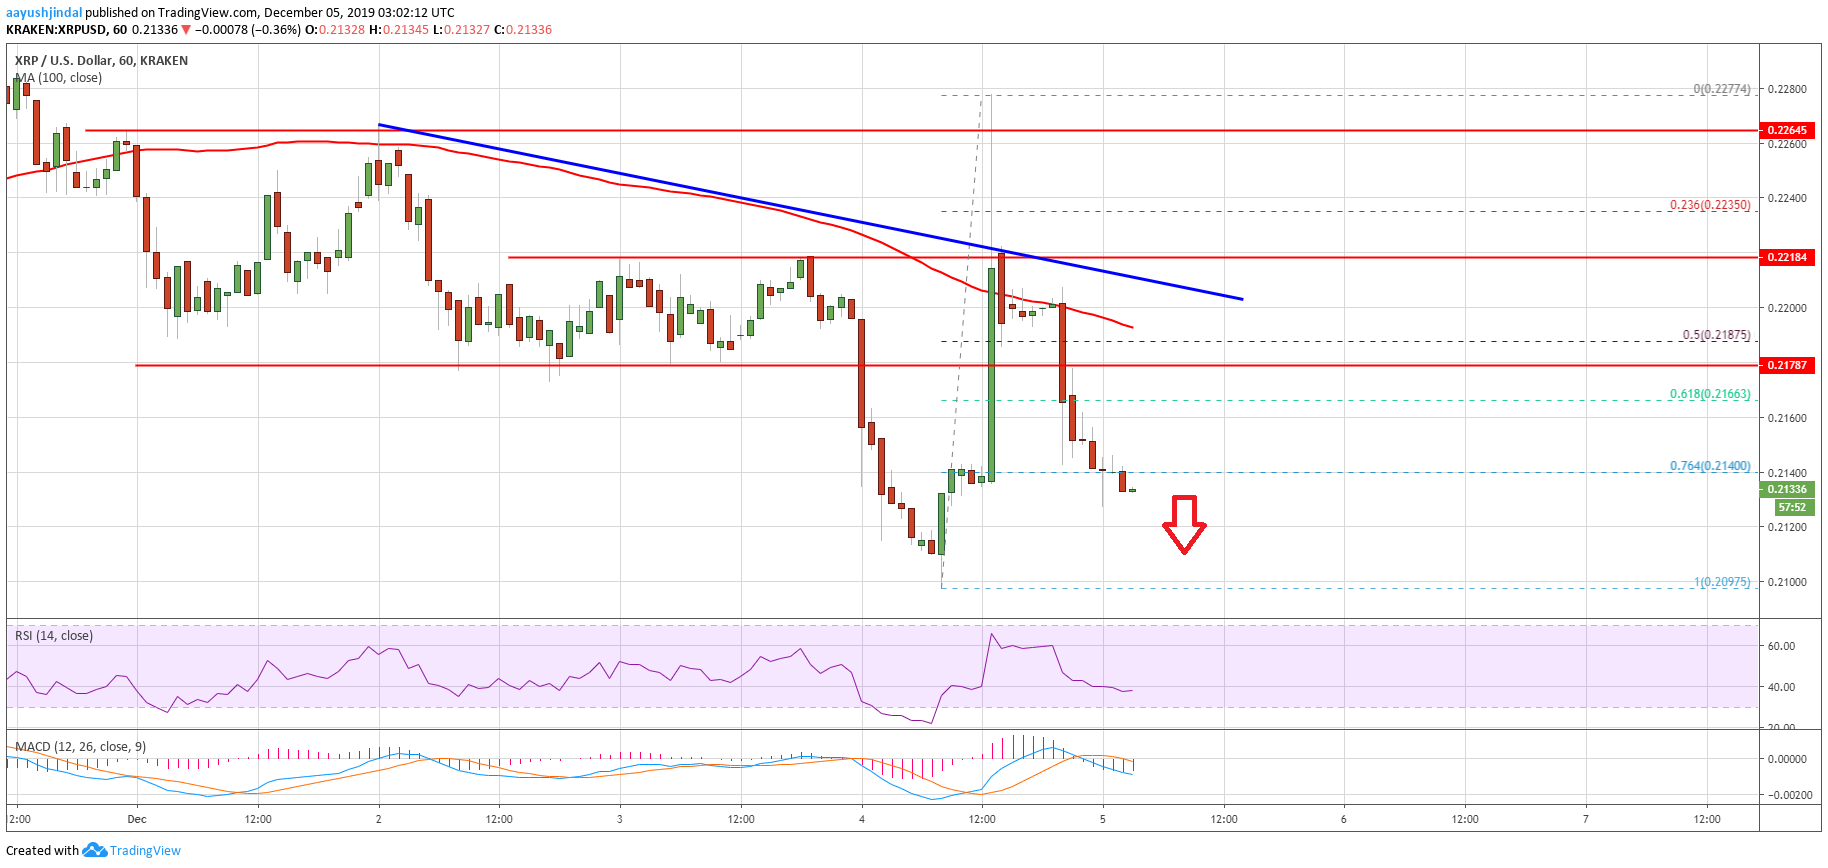
  • Ripple price rallied recently above the $0.2220 resistance, but failed near $0.2265 against the US dollar.
  • The price currently declining and it is approaching the pre-rally level near $0.2100.
  • There is a new bearish trend line forming with resistance near $0.2210 on the hourly chart of the XRP/USD pair (data source from Kraken).
  • Ethereum is also down and moving towards the $142 support area.

Ripple price is still trading in downtrend despite the recent rally against the US Dollar, similar to bitcoin. XRP price is likely to revisit the $0.2000 support in the near term.

Ripple Price Analysis

After tagging the $0.2100 support area, ripple started a strong rise above $0.2200 resistance area against the US Dollar. Moreover, XRP price rallied above the $0.2220 resistance and the 100 hourly simple moving average.

However, the $0.2265 and $0.2270 levels acted as a strong barrier. A swing high was formed near $0.2277 and the price started trimming gains. It traded below the $0.2180 level and the 100 hourly simple moving average.

Besides, the price broke the 50% Fib retracement level of the recent rally from the $0.2097 low to $0.2277 high. Clearly, ripple price made a failed attempt to start a strong recovery above the $0.2220 and $0.2265 levels.

It is now trading below the 76.4% Fib retracement level of the recent rally from the $0.2097 low to $0.2277 high. Therefore, there is a risk of a downside break below the $0.2100 support area in the near term.

In the mentioned case, the price could even trade below the $0.2050 support area. The main support is near the $0.2000 level, where the bulls are likely to take a stand.

Any further losses could push ripple in a nasty downtrend towards $0.1900 or may be $0.1850. On the upside, there are many resistances near the $0.2150 and $0.2180 levels.

Additionally, there is a new bearish trend line forming with resistance near $0.2210 on the hourly chart of the XRP/USD pair. An intermediate resistance is near $0.2200 and the 100 hourly SMA. If the price climbs above the $0.2200 and $0.2210 resistance levels, it could move into a bullish zone.

Ripple Price

Ripple Price

Looking at the chart, ripple price is down and out below $0.2180. Thus, there are high possibilities of a downside extension below the $0.2100 and $0.2050 levels in the coming sessions. The bears seem to be aiming the $0.2000 support.

Technical Indicators

Hourly MACD – The MACD for XRP/USD is currently gaining pace in the bearish zone.

Hourly RSI (Relative Strength Index) – The RSI for XRP/USD is declining and it is well below the 50 level.

Major Support Levels – $0.2100, $0.2050 and $0.2000.

Major Resistance Levels – $0.2180, $0.2200 and $0.2210.

The post Ripple (XRP) Price Could Revisit $0.2000, BTC & ETH Under Pressure appeared first on NewsBTC.


from NewsBTC https://ift.tt/2Rjywrl

Thailand and Hong Kong in Crypto Collaboration With Cross Border Token Project

December 04, 2019 0

Central banks are increasingly looking towards more efficient payment methods and crypto tokens are filling that role. Thailand and Hong Kong have just announced a joint agreement to utilize digital currencies to facilitate quicker payment in bilateral trade.

Cross Border Crypto

Central banks are beginning to realize that the options for cross border payments are woefully dated, painfully slow and ridiculously expensive. Yes, we’re talking about SWIFT.

The explosive growth of the crypto industry, which is really only a few years old, has highlighted how easy, fast and cheap it is to send money across international borders via a secure and immutable distributed ledger.

Nations, especially in Asia, are looking towards crypto to ease the process of sending finances overseas and Thailand and Hong Kong are the latest to embrace the embryonic technology.

According to reports, the two nations have entered an agreement to roll out a two-tier digital token as part of the process to create a prototype for cross-border transfers. The initiative has been dubbed Project LionRock-Inthanon and the first tier involves the issuance of a crypto token to participating banks.

According to the Hong Kong Monetary Authority (HKMA), the second tier involves the banks distributing these crypto tokens to their corporate customers for settling wholesale payments. The fintech collaboration between the HKMA and the Bank of Thailand was established in May.

The two nations have bilateral trade worth an estimated $US20 billion per year and the new system will give businesses a competitive edge over inflated exchange rate mechanisms between the two currencies.

Project LionRock is focused on streamlining cross-border transfers and payments between banks and companies rather than replacing cash as the People’s Bank of China intends to do with its crypto yuan. HKMA senior executive director Edmond Lau added;

“The prospect of issuing a central bank digital currency for retail purpose in Hong Kong is limited, as we have so many retail payment services (ranging from) credit card, debit card, and (others),”

He continued to state that the HKMA and Bank of Thailand will announce more details on their proof-of-concept study during the first quarter of 2020. Thailand’s central bank has already been researching its own central bank digital currency (CBDC) under ‘Project Inthanon’. The initiative involves banks such as HSBC, Standard Chartered, and a number of Thai banks including Kasikorn Bank and Krungthai Bank.

The Kingdom has recently opened its doors to crypto currencies by amending regulations to favor the industry and innovation.

Not Using Ripple

The system appears to be similar to that offered by San Francisco based fintech firm Ripple. The company’s loyal followers, also known as the ‘XRP Army’, have been insistent that banks will be using their token. This latest announcement proves that they are more likely to just develop their own rather than rely on one controlled by a third party.

Image from Shutterstock

The post Thailand and Hong Kong in Crypto Collaboration With Cross Border Token Project appeared first on NewsBTC.


from NewsBTC https://ift.tt/2YmLsyb

Ethereum (ETH) Rip & Dip Scenario Was Total Disaster

December 04, 2019 0
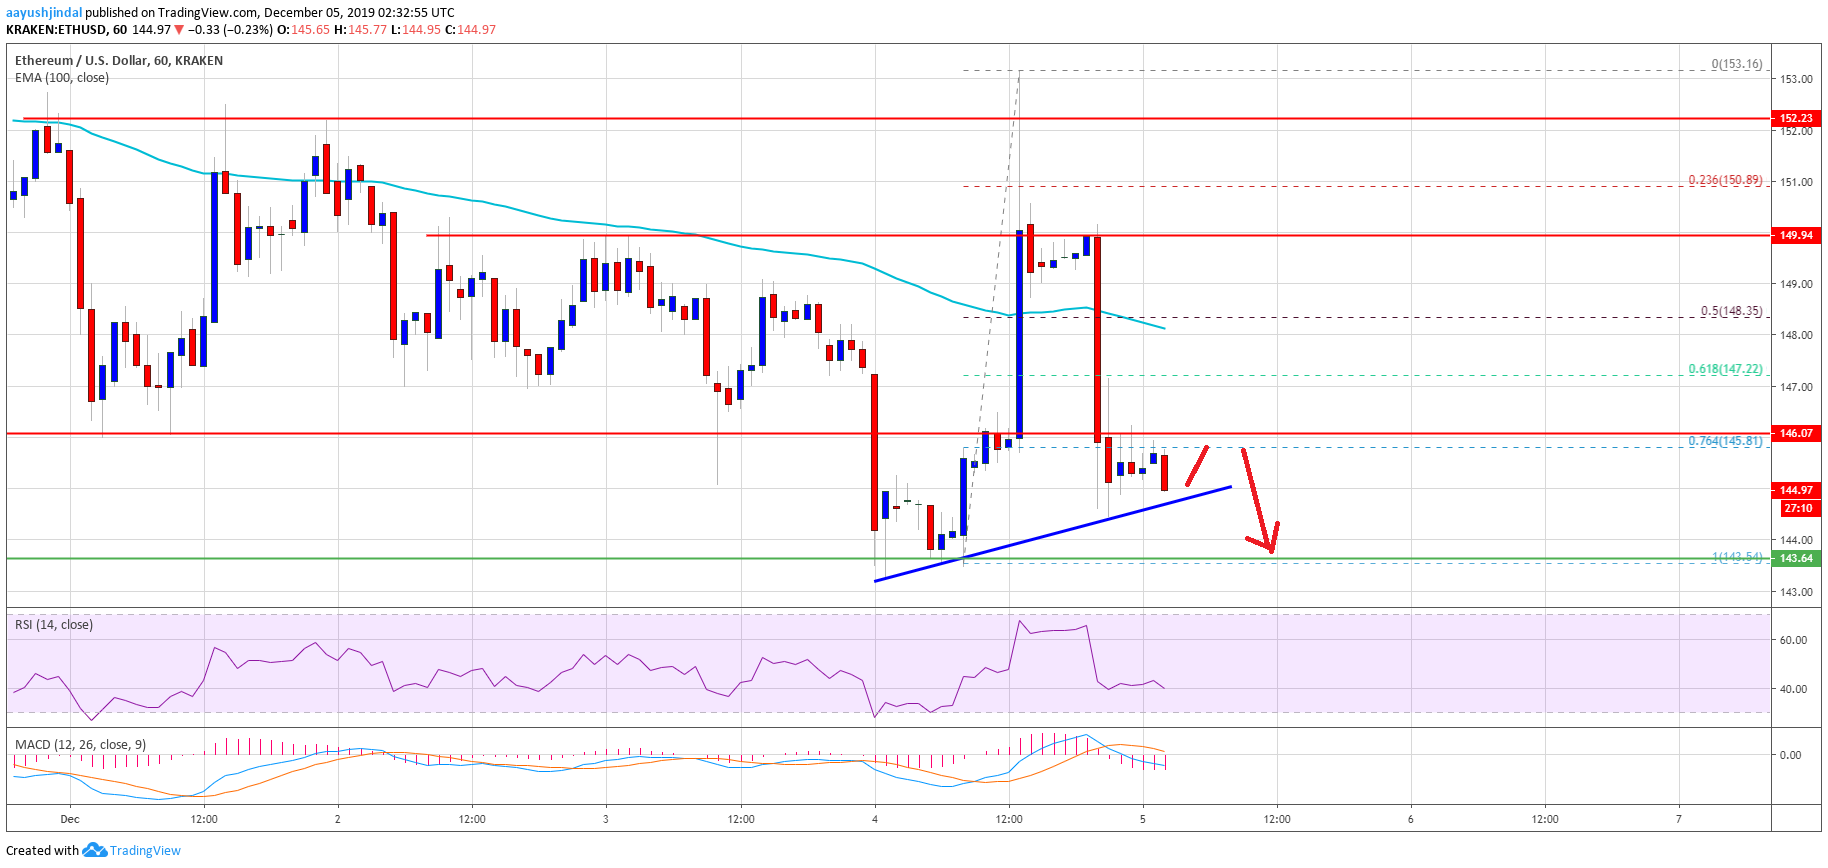
  • Ethereum rallied sharply above the $150 resistance, but failed near $152 against the US Dollar.
  • The price is trimming gains and it is back to pre-rally levels near the $144 support.
  • There is a short term bullish trend line forming with support near $145 on the hourly chart of ETH/USD (data feed via Kraken).
  • The price remains at a risk of more losses below the $145 and $144 support levels.

Ethereum price rally above $150 seems to be fake versus the US Dollar, similar to bitcoin. ETH price is back below $150 and it could continue to move down.

Ethereum Price Analysis

Recently, Ethereum started a strong upward move above the $148 and $150 resistance levels against the US Dollar. Moreover, ETH price spiked above the $152 resistance and the 100 hourly simple moving average.

However, the price failed to retain the bullish momentum and topped near the $153 level. As a result, there was a fresh decline below $150 and the price trimmed most its gains.

Besides, the price is trading below the 50% Fib retracement level of the recent rally from the $144 swing low to $153 high. More importantly, Ethereum is back below the $148 level and the 100 hourly simple moving average.

At the moment, the price is declining below the 76.4% Fib retracement level of the recent rally from the $144 swing low to $153 high. An immediate support is near the $145 and $144 levels.

Additionally, there is a short term bullish trend line forming with support near $145 on the hourly chart of ETH/USD. If there is a downside break below the $145 and $144 support levels, the price could even trade below the $142 level.

The next major support is near the $140 level, below which it may perhaps test $135. On the upside, an initial resistance is near the $146 level, followed by $148.

The main resistances are still near the $150 and $152 levels. A successful close above the $152 level is needed for the bulls to take control. In the mentioned case, the price is likely to accelerate higher towards the $158 and $160 resistance levels.

Ethereum Price

Ethereum Price

Looking at the chart, Ethereum price is back in a bearish zone and the recent rally above $150 turned out to be a total disaster. If the price continues to move down, there are chances of a downside break below the $140 level.

ETH Technical Indicators

Hourly MACD The MACD for ETH/USD is now back in the bearish zone, with negative signs.

Hourly RSI The RSI for ETH/USD is back below the 50 level, with a bearish angle.

Major Support Level – $142

Major Resistance Level – $150

The post Ethereum (ETH) Rip & Dip Scenario Was Total Disaster appeared first on NewsBTC.


from NewsBTC https://ift.tt/2LlUrus

Ethereum (ETH) Holding Uptrend Support, Bitcoin Recovering

December 02, 2019 0
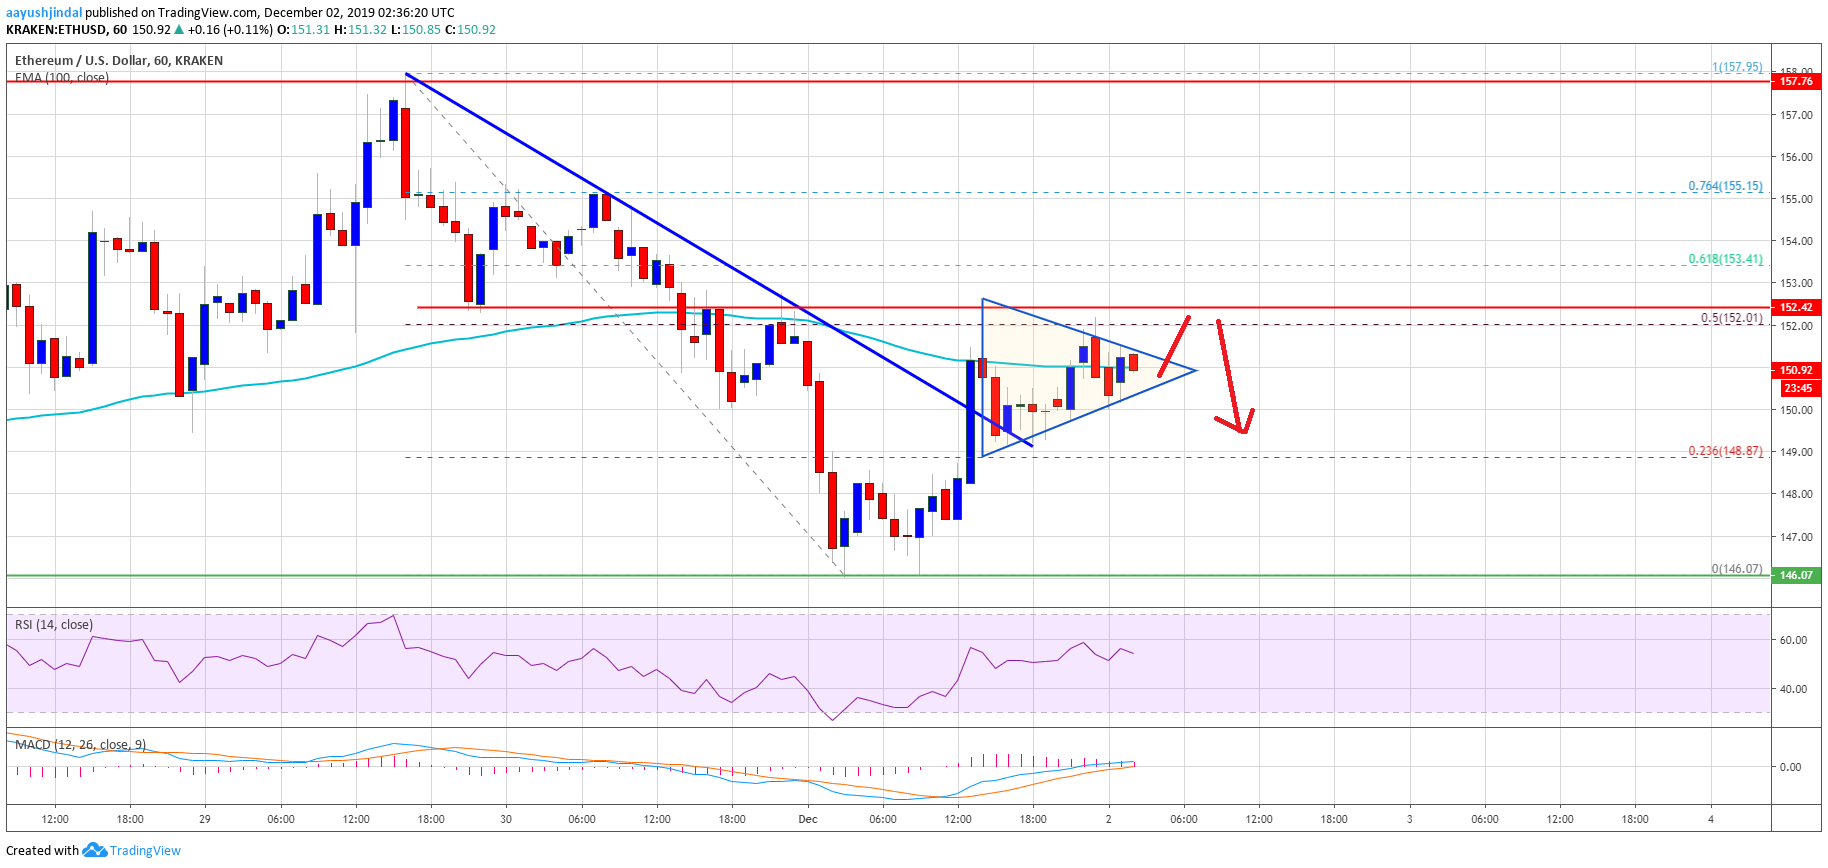
  • Ethereum is trading above the key $145 and $146 support levels against the US Dollar.
  • The price is likely to surpass the $150 and $152 resistance levels in the near term.
  • There is a new connecting bearish trend line forming with resistance near $150 on the hourly chart of ETH/USD (data feed via Kraken).
  • The price is likely to accelerate higher once it clears the $152 resistance zone.

Ethereum price is holding a couple of key supports versus the US Dollar and bitcoin. ETH price is likely to climb above $152 as long as it is above $146.

Ethereum Price Analysis

Recently, we saw a fresh decrease in Ethereum after it failed to climb above the $158 resistance area against the US Dollar. ETH price traded below the $150 support area and the 100 hourly simple moving average.

However, the $145 and $146 levels provided support. A swing low was formed near $146 and the price started correcting recent losses. It recovered above the $150 level, but it struggled to clear the $152 resistance.

Finally, there was another test of the $146 support and the price is currently consolidating in a range. Moreover, the price is trading above the 23.6% Fib retracement level of the recent decline from the $152 high to $147 low.

An immediate resistance is near the $150 level and the 100 hourly simple moving average. Besides, there is a new connecting bearish trend line forming with resistance near $150 on the hourly chart of ETH/USD.

The 50% Fib retracement level of the recent decline from the $152 high to $147 low is also near the trend line resistance. If there is a clear break above the $150 resistance, Ethereum price could continue to rise.

Therefore, a break above the trend line and the 100 hourly simple moving average could push the price towards the $152 resistance levels. If the bulls gain pace above the $152 resistance, the price is likely to accelerate higher.

The next key resistances are near the $158 and $160 levels. Conversely, the price could struggle to continue above $150 and $150 resistances. In the mentioned case, it may perhaps retest the $146 support.

Ethereum Price

Ethereum Price

Looking at the chart, Ethereum price is clearly trading near a couple of key hurdles such as $150 and $152. Thus, it could either rally above $152 or attempt a downside break below the $146 support area. The next major support is near the $142 level.

ETH Technical Indicators

Hourly MACD The MACD for ETH/USD is slowly moving in the bullish zone.

Hourly RSI The RSI for ETH/USD is currently above the 50 level, with a bullish angle.

Major Support Level – $146

Major Resistance Level – $152

The post Ethereum (ETH) Holding Uptrend Support, Bitcoin Recovering appeared first on NewsBTC.


from NewsBTC https://ift.tt/2OJukzJ

Ethereum (ETH) Setting For Breakout or Further Decline?

December 01, 2019 0
  • Ethereum is holding the key $145 support area and recovering against the US Dollar.
  • The price is currently facing a strong resistance near the $152 area.
  • Earlier, there was a break above a major bearish trend line with resistance near $150 on the hourly chart of ETH/USD (data feed via Kraken).
  • The price remains well bid, but it might struggle to climb further above $152 and $155.

Ethereum price is facing an uphill task versus the US Dollar and bitcoin. ETH price must break the $152 and $155 resistance levels to continue higher.

Ethereum Price Analysis

Recently, there was a downside correction in Ethereum from the $158 resistance area against the US Dollar. ETH price declined below the $152 support area and the 100 hourly simple moving average.

Moreover, the price broke the $150 support area and traded close to the $145 support. A low was formed near $146 and the price is currently recovering. It climbed above the $148 resistance level.

Besides, there was a break above the 23.6% Fib retracement level of the latest decline from the $158 high to $146 low. More importantly, there was a break above a major bearish trend line with resistance near $150 on the hourly chart of ETH/USD.

However, the $152 support area and the 100 hourly simple moving average are now acting as hurdles. Additionally, the 50% Fib retracement level of the latest decline from the $158 high to $146 low is acting as a resistance.

Ethereum price is now trading inside a contracting triangle with resistance near the $151 level on the same chart. Therefore, an upside break above the $151 and $152 levels might push the price further higher.

The next key resistance is near the $155 level, above which it could rise towards the main $158 resistance area. Conversely, the price could fail to continue higher and decline below $148.

An immediate support is near the $146 and $145 levels. Any further losses might push the price into a bearish zone towards the $140 and $138 levels. The main support is near the last month low near $132.

Ethereum Price

Ethereum Price

Looking at the chart, Ethereum price is showing a few bearish signs below the $152 and $155 resistance levels. Having said that, the price must clear the $158 hurdle to move into a medium term uptrend. If not, it may perhaps resume its decline below the $145 and $140 levels.

ETH Technical Indicators

Hourly MACD The MACD for ETH/USD is losing gaining pace in the bullish zone.

Hourly RSI The RSI for ETH/USD is currently above the 50 level and it could decline again.

Major Support Level – $146

Major Resistance Level – $152

The post Ethereum (ETH) Setting For Breakout or Further Decline? appeared first on NewsBTC.


from NewsBTC https://ift.tt/2OFeMwB

Despite 15% Bounce, Bitcoin Price Still Bearish on Weekly: Analyst

December 01, 2019 0

After hitting $6,600, Bitcoin (BTC) saw a strong price bounce, returning to $7,800 just yesterday. Though, analysts have asserted that the cryptocurrency market remains in a weak state, despite the nearly 20% recovery that has been seen over the past week.

Related Reading: Dr. Doom: Ethereum Still a Long Way From $0, Its True “Fundamental Value”

Bitcoin Looking Weak on Weekly

Popular trader NebraskanGooner recently noted that Bitcoin’s weekly chart looks bearish, again in spite of the fact that a recovery was seen after the strong move lower. The analyst specifically remarked that BTC failed to break the key 99-week simple moving average and a horizontal zone of resistance, before adding that the “increased buyer volume” narrative is a clear misnomer and that the on-balance volume indicator saw a bearish retest.

With that in mind, the cryptocurrency trader remarked that he expects for Bitcoin to see a “slow bleed” lower, which will be marked by investors trying to buy the dip and then being stopped out, then a “fast dip with rapid absorption” in the $6,000s.

Fractal Also Suggests Pain to Come

That’s not all. Per previous reports from NewsBTC previously, Nebraskan recently observed that a bearish fractal, when the historical price pattern or direction of an asset is reflected/seen again on a different time frame and/or for a different asset, is playing out for Bitcoin.

Nebraskan’s fractal has been extremely accurate over the past few weeks. In fact, it predicted Bitcoin’s dramatic price drop to $6,600 weeks before it took place, and the subsequent recovery to nearly $8,000 seen over the past few days.

The same fractal, which is an overlay of one of Bitcoin’s previous market cycles, suggests that Bitcoin’s trend line breakdown retest, implies that BTC has found a local top at $7,800. Should the fractal continue to play out, BTC will head towards the $6,200-$6,300 region in the coming two-odd weeks, which would mark a drop of 20%.

Fundamentals may support this. UpBit, earlier this week, was hacked for $50 million worth of Ethereum, leading some to suggest that selling pressure from this event will depress the cryptocurrency market in the coming weeks. There has been also talk of how operators of the PlusToken cryptocurrency scam could be dumping 1,000s of Bitcoin a day, leading to a natural downtrend in price.

Related Reading: Make or Break: Bitcoin Price Closing In On Key Monthly Support Level
Featured Image from Shutterstock

The post Despite 15% Bounce, Bitcoin Price Still Bearish on Weekly: Analyst appeared first on NewsBTC.


from NewsBTC https://ift.tt/2DwWxD8

Ethereum Price Weekly Forecast: ETH At Potentially Significant Turning Point

November 30, 2019 0
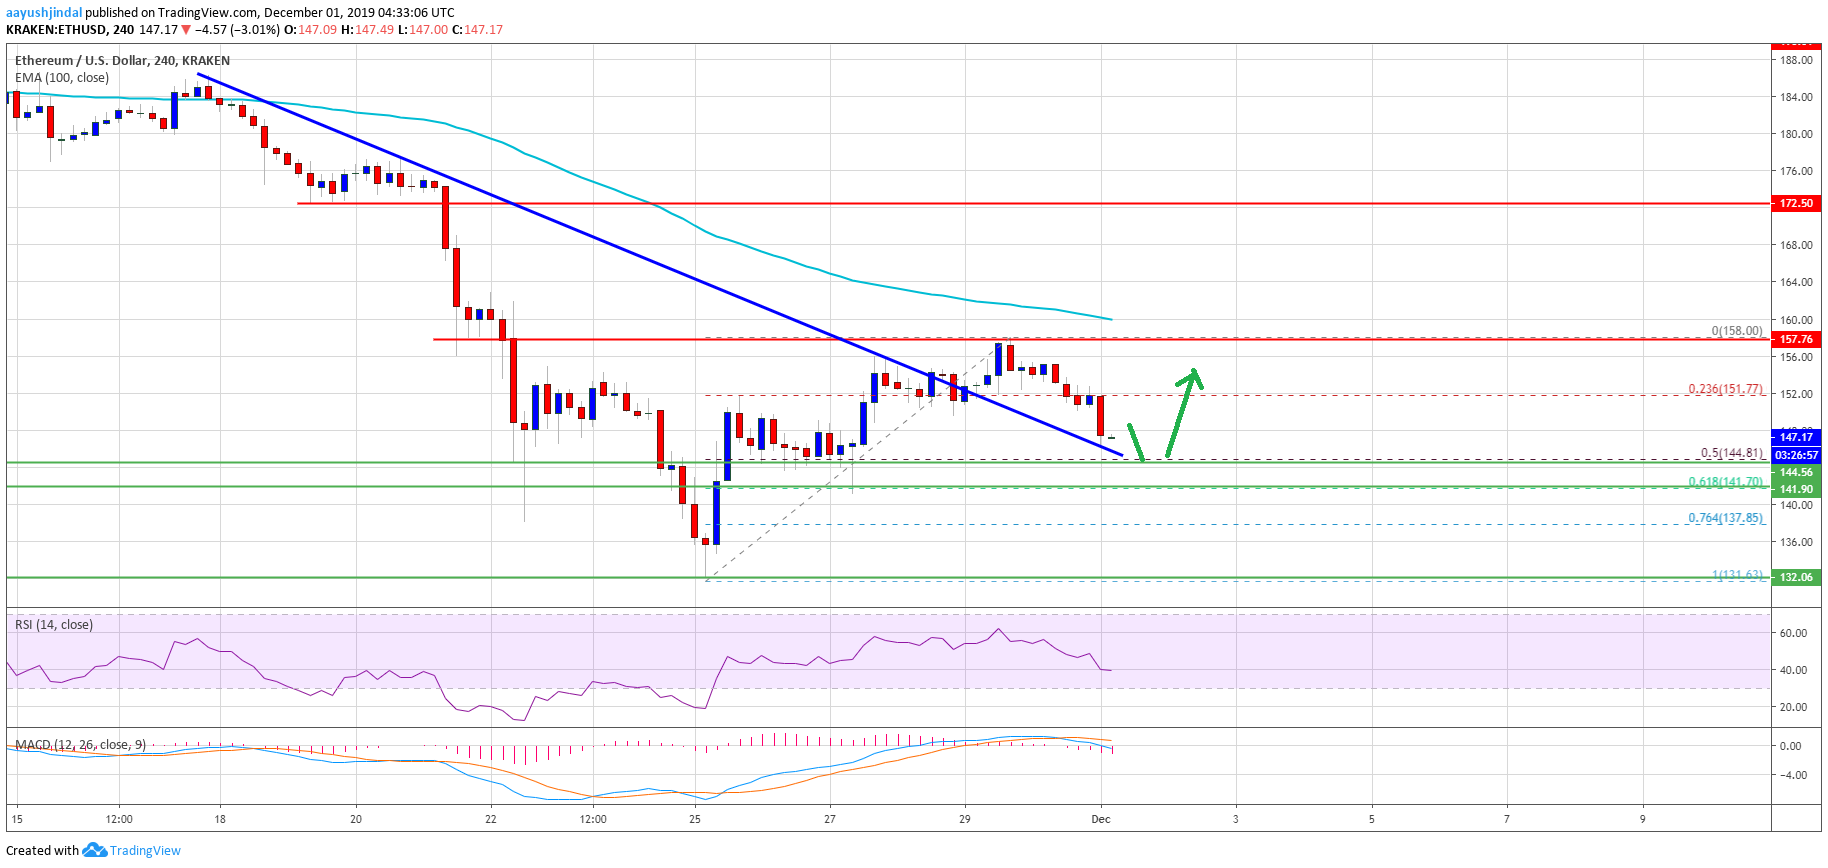
  • ETH price is currently trimming gains from the $158 resistance area against the US Dollar.
  • The price is now approaching a couple of important supports near the $144 area.
  • Earlier, there was a break above a major bearish trend line with resistance near $152 on the 4-hours chart of ETH/USD (data feed via Kraken).
  • The pair is likely to bounce back as long as it is above the $142 support area.

Ethereum price is approaching a crucial support area against the US Dollar, similar to bitcoin. ETH price must hold the $142 support to climb towards $160.

Ethereum Price Weekly Analysis

This past week, Ethereum started a solid recovery above the $142 resistance area against the US Dollar. Furthermore, ETH price surpassed a major resistance area near the $150 level.

More importantly, there was a break above a major bearish trend line with resistance near $152 on the 4-hours chart of ETH/USD. Besides, the pair surpassed the $155 resistance area, but it struggled to gain momentum above $158.

A swing high was formed near $158 and the price remained well below the 100 simple moving average (4-hours). Ethereum is currently correcting lower below the 23.6% Fib retracement level of the upward move from the $131 swing low to $158 high.

The price is now approaching the broken trend line and the $145 support area. Additionally, the 50% Fib retracement level of the upward move from the $131 swing low to $158 high is near the $145 level.

The main support is near the $142 area. It is near the 61.8% Fib retracement level of the upward move from the $131 swing low to $158 high. Therefore, a downside break below the $142 support area could reduce chances of another upward move in the near term.

In the mentioned scenario, the price is likely to revisit the $134 and $132 support levels. On the upside, the first key resistance is near the $152 level. The key resistance area is near the $158 and $160 levels.

Thus, a clear break above the $160 level and the 100 simple moving average (4-hours) may perhaps push the price back into a positive zone.

Ethereum Price

Ethereum Price

The above chart indicates that Ethereum price is clearly approaching a couple of important supports near $145 and $142. As long as the price is above $142, it could bounce back. If not, the bears are likely to aim $132 or $125.

Technical Indicators

4 hours MACD – The MACD for ETH/USD is currently gaining strength in the bullish zone.

4 hours RSI – The RSI for ETH/USD is currently declining and it is near the 40 level.

Major Support Level – $142

Major Resistance Level – $160

The post Ethereum Price Weekly Forecast: ETH At Potentially Significant Turning Point appeared first on NewsBTC.


from NewsBTC https://ift.tt/2qS7bC3

Bitcoin Weekly Forecast: BTC Eyeing Last Line Of Defense

November 30, 2019 0
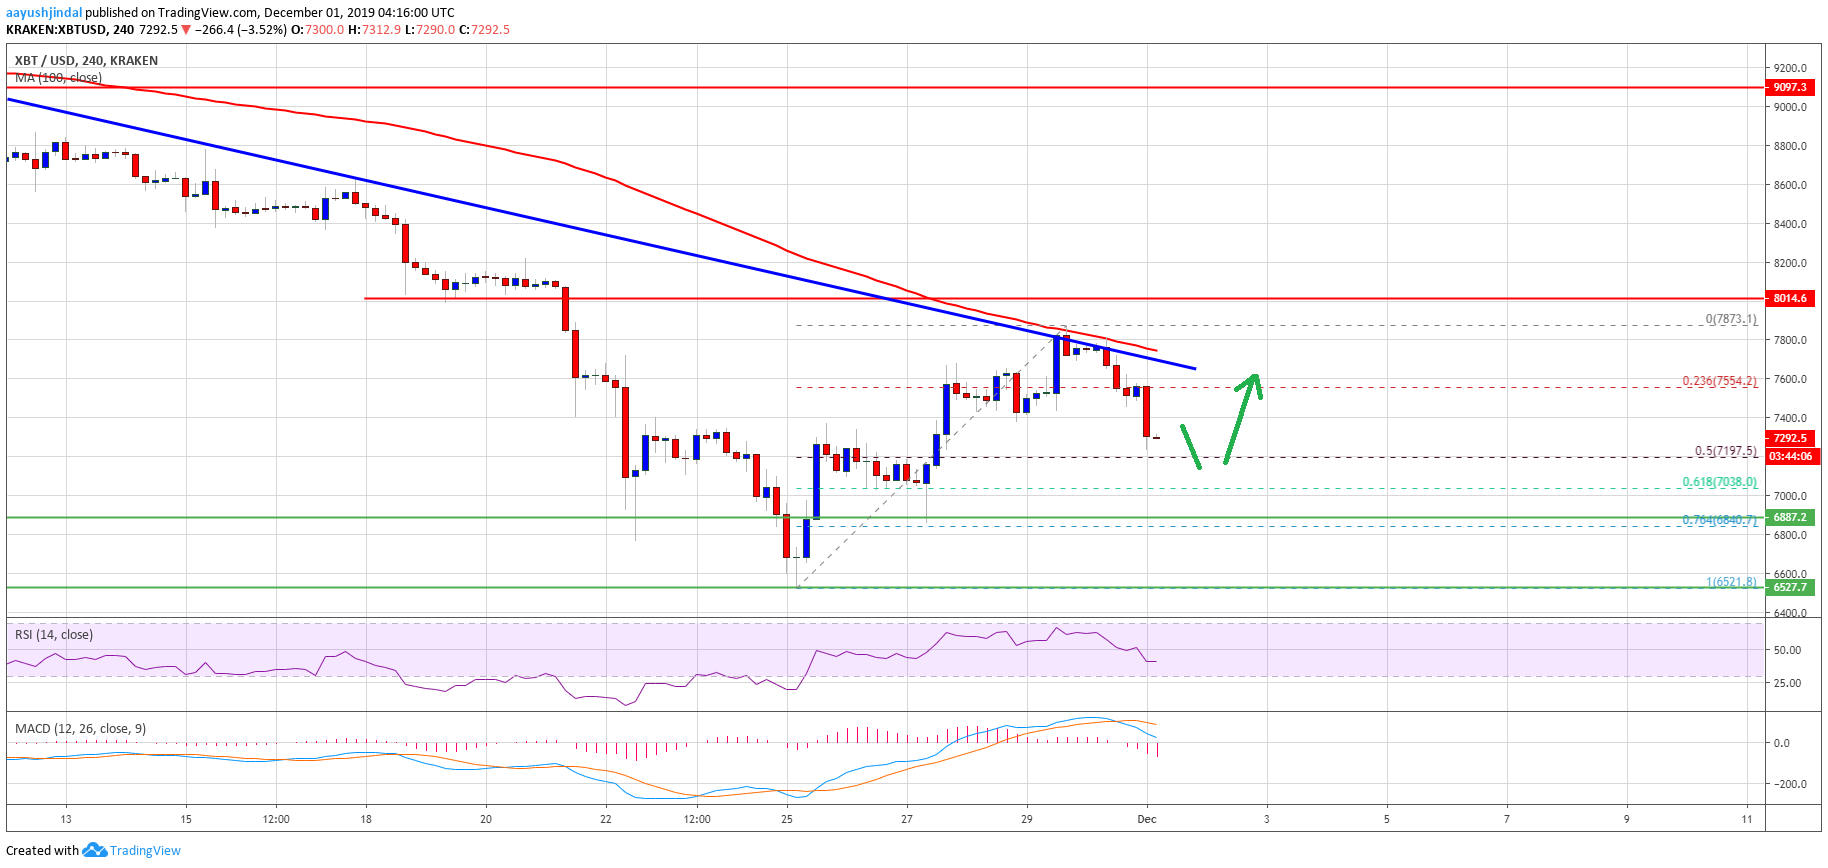
  • After a decent recovery, bitcoin price faced resistance near the $7,880 level against the US Dollar.
  • The price is currently correcting gains and it is trading near the $7,300 support area.
  • There is a crucial bearish trend line forming with resistance near $7,678 on the 4-hours chart of the BTC/USD pair (data feed from Kraken).
  • The price might test $7,200 or $7,000 before a fresh wave towards the $7,700 resistance.

Bitcoin price is struggling to continue higher above $7,500 and $7,800 against the US Dollar. BTC is approaching the $7,000 support and it could bounce back.

Bitcoin Price Weekly Analysis (BTC)

This past week, bitcoin started a decent recovery wave from the $6,521 low against the US Dollar. BTC price gained pace above the $7,000 resistance area. Moreover, there was a break above the key $7,400 resistance area.

Finally, the price rallied above the $7,600 level, but it struggled to test the $8,000 resistance area. It seems like the price formed a short term top near the $7,880 area and the 100 simple moving average (4-hours).

More importantly, there is a crucial bearish trend line forming with resistance near $7,678 on the 4-hours chart of the BTC/USD pair. Bitcoin price is currently correcting lower below the $7,500 level.

Besides, the price is now trading below the 23.6% Fib retracement level of the recent wave from the $6,521 low to $7,873 high. On the downside, an immediate support is near the $7,200 level.

Additionally, the 50% Fib retracement level of the recent wave from the $6,521 low to $7,873 high is near the $7,197 level to provide support. If there are more downsides, the price could test the main $7,000 support area in the near term.

Therefore, a daily close below the main $7,000 support could start a fresh bearish wave. In the mentioned case, the price is likely to break the $6,500 support in the near term.

On the upside, the price is facing a lot of hurdles near the $7,700 and $7,800 levels. However, the price must settle above the $8,000 resistance area, the trend line, and the 100 simple moving average (4-hours) to start a strong rise in the coming weeks.

Bitcoin Price

Bitcoin Price

Looking at the chart, bitcoin price is facing a fresh round of selling below $7,500. Though, the price is approaching a couple of important supports near $7,200 and $7,000, where the bulls are likely to take a stand.

Technical indicators

4 hours MACD – The MACD for BTC/USD is currently gaining bearish momentum.

4 hours RSI (Relative Strength Index) – The RSI for BTC/USD is now declining and it is well below the 50 level.

Major Support Level – $7,000

Major Resistance Level – $7,700

The post Bitcoin Weekly Forecast: BTC Eyeing Last Line Of Defense appeared first on NewsBTC.


from NewsBTC https://ift.tt/2DA4rvL

Party is Over: Bitcoin Slips to $7,400, Making $6,000s a Possibility Again

November 30, 2019 0

After hitting $6,600, Bitcoin (BTC) saw a strong price bounce, returning to $7,800 just yesterday. This marked an increase of nearly 20% from the bottom, making some convinced that the bottom is in. Though, over the past 12 hours, the cryptocurrency has started to slip once again, eliciting bearish responses from an array of industry analysts.

Related Reading: Quitting Crypto Now is Akin to Selling Amazon in 2003: Analyst

Bitcoin Slips to $7,400

As of the time of writing this article, Bitcoin is trading for $7,400 on many major exchanges, having shed 3% of its value in the past 24 hours. While this wasn’t a decisively bearish movement that implies new lows are coming, analysts are convinced that it’s a precursor of pain to come.

Popular trader Inmortal Technique recently observed that the uptrend from the $6,600 level has been increasingly bearish, with each impulse higher (of which there were three) having less buying volume, implying bulls were losing momentum. That’s not to mention that the three impulses higher fell short of a clear support zone close to the $8,000s. He thus claimed that the “party is over.”

Jonny Moe noted that the recent price action satisfies a rising wedge he drew out on his chart. Rising wedges are bearish chart patterns seen in financial markets that often reject lower. A loss of the triangle could imply that BTC will reenter the $6,000s.

Related Reading: “All-Knowing” Bitcoin Fractal That Predicted Drop to $6,600: BTC to Fall 20%

Fundamentals Back Bearish Narrative

It seems that the fundamentals back the bearish narrative, unfortunately enough. Earlier this week, Korean exchange UpBit revealed in an announcement that a 342,000 Ethereum (then valued at $50 million) transaction was suspicious. The translated version of a related release did not contain the word “hack,” though many have taken the statement as a sign that the $50 million worth of cryptocurrency has been misplaced and is currently unretrievable.

Upbit has confirmed that it will cover the funds with up to $51 million worth of its corporate funds, and has also revealed that it has moved all cryptocurrencies into its cold wallet to protect its customers.

Some suggest that the selling pressure from this event could depress the cryptocurrency market in the coming weeks.

Related Reading: Dr. Doom: Ethereum Still a Long Way From $0, Its True “Fundamental Value”
Featured Image from Shutterstock

The post Party is Over: Bitcoin Slips to $7,400, Making $6,000s a Possibility Again appeared first on NewsBTC.


from NewsBTC https://ift.tt/37T5MM4

Why Expiry of CME Bitcoin Futures Suggests BTC Price to Soon Pass $8,000

November 29, 2019 0

On Friday, the Chicago Mercantile Exchange’s cash-settled Bitcoin futures contract for the month of November was reported to have expired by a number of analysts. While these financial derivatives are cash-settled, analysis by a top cryptocurrency trader suggests that the expiry of the monthly futures means that BTC has a positive price trajectory into the coming two weeks.

Related Reading: Eerie Bitcoin Fractal Suggests Bottom in at $6.6k, Surge to $8k Likely

Why BTC Price Likely to Surpass $8,000 Next Week

Popular CNN-featured trader Luke Martin recently released an analysis about the expiry of CME monthly futures and their effect on the BTC price. He found in his research (which factored in data going back to the June 2018 expiry) that BTC largely trends positively in the one or two weeks after the expiry of a future; Bitcoin sees a 2.9% average gain one week after expiry, and a 3.9% average gain two weeks after expiry.

Yes, an average 2.9% gain in a week isn’t that much by cryptocurrency standards, but these statistics show that Bitcoin’s directionality in the coming weeks should be positive should history repeat itself.

Martin’s analysis of the CME expiries corroborates other bullish analyses that have been proposed by investors in the industry. For instance, Velvet, a trader who partially foresaw the decline of BTC to under $8,000, then $7,000, wrote that he thinks Bitcoin is looking extremely bullish right now.

Per previous reports from NewsBTC, he remarked that BTC  has finished a five-phase wave pattern, has bounced off the golden Fibonacci Retracement level at the 50-day moving average, and is in the midst of a giant falling wedge — all telltale signs that the cryptocurrency is about the surge higher. His chart implies a move to $8,600 in the coming days.

CME Futures Net Negative for Bitcoin?

While the expiry of the futures may be a net positive in the short term for the price of Bitcoin, some analysts are certain that the CME’s contracts are actually suppressing BTC from a long-term perspective.

Speaking to popular industry content creator Ivan on Tech, renowned Bitcoin educator Andreas Antonopoulos, said that the CME futures market likely has much to do with the decline in the price of BTC over the past two years:

“We know for a fact that when the Bitcoin bubble started to go up really fast in 2017, the U.S. Treasury decided to fast-track the deployments of futures markets in order to stop that bubble.”

The post Why Expiry of CME Bitcoin Futures Suggests BTC Price to Soon Pass $8,000 appeared first on NewsBTC.


from NewsBTC https://ift.tt/2OBcqiy

No Bitcoin Capitulation This Year Could Indicate BTC Bottom Is In

November 29, 2019 0

Bitcoin continues to crank higher as we end the weekend rounding out a week of gains. The move has led analysts to question whether the dump to $6,500 was the bottom and a trend reversal has finally begun.

Bitcoin Edges Towards Resistance

There is still a long way to go before any measurable trend reversal can be confirmed. Today has been another of gains as BTC topped out at $7,850 a few hours ago. Glancing at the five day chart would paint a very bullish picture.

bitcoin

Zooming out to look at the whole month however tells a completely different story. Bitcoin has dumped almost 30% in November to bottom out in the mid-$6k zone. Since that trough on Monday it has recovered almost 20% but still has a lot of work ahead.

The next significant resistance zone is around $8,200 and beyond that it needs to push above $9k for technical indicators to start turning bullish.

Analysts have noted that unlike in 2018 when BTC dumped 50% in a matter of days, there has been no capitulation this time around, just a steady sell off over five months.

“Bitcoin has been down 50% since June, but there has not been any type of capitulation (like what we saw last November/December)”

A further 40% down from these levels would put Bitcoin in the $4,600 area which is still higher than the 2018 bottom. This would entail a total correction of 67% however and cause a lot of anxiety within the industry.

Still, this correction would not be as heavy as last year’s when BTC dumped 84%. The crypto winter instilled a stronger sense of hodling which may be why the asset will not repeat those lows and could well have been at the bottom already for this bear run.

Day traders are enjoying these short term pump and dumps but those in it for the long run are looking for accumulation areas.

Elsewhere on Crypto Markets

Since Monday’s seven month low, total crypto market capitalization has grown by $30 billion, or 17%. While this sounds impressive, the overall trend is still bearish since markets have lost 24% since the beginning of November.

Since the beginning of the year things are still in the positive zone but that is largely due to Bitcoin. Most of the altcoins have lost all of their gains this year falling back to January levels. Some, such as XRP are at their lowest levels for two years.

Ethereum is another lack luster crypto asset as it fails to gain any independent momentum despite a network upgrade next weekend and a growing DeFi ecosystem. ETH prices are still low at $155 which is where they were back in early January during the depths of crypto winter.

This year’s bottom could have been in this week, but Bitcoin’s next direction will confirm it.

Image from Shutterstock

The post No Bitcoin Capitulation This Year Could Indicate BTC Bottom Is In appeared first on NewsBTC.


from NewsBTC https://ift.tt/2L2n3IX
Theme images by Jason Morrow. Powered by Blogger.